Solana’s native token SOL experienced a 12% plunge in just seven days after reaching $103 on Jan. 18. Some analysts may argue that the upside remains for the “Ethereum killer”, as its current price of $84 represents a180% gain over the last 90 days.
However, crypto traders tend to shift their portfolios swiftly when better opportunities arise. Investors are now questioning whether Solana’s network activity, on-chain data and technical outlook confirms the deteriorating sentiment toward SOL’s price.
Solana’s declining TVL backs SOL’s downside
The rally in SOL’s price at the end of 2023 was attributed to the buzz around airdrops within the SOL ecosystem after JITO and BONK were listed on major crypto exchanges.
The bullish momentum was also supported by a significant surge in volume within Solana’s decentralized applications (DApps) ecosystem. This occurred as multiple rival blockchains experiencing outages due to increased activity in December 2023, including Arbitrum, zkSync and the BNB Chain.
However, after the initial rush, Solana SPL tokens are down 40%, 41%, and 44% for Jito (JTO), DogWifHat (WIF), and BONK respectively. iInvestors are questioning whether there is anything else to support SOL’s $36billion valuation that makes it the fifth-largest cryptocurrency.
A closer look at Solana’s total value locked (TVL) reveals that demand has been declining, although it’s not yet a point of concern.
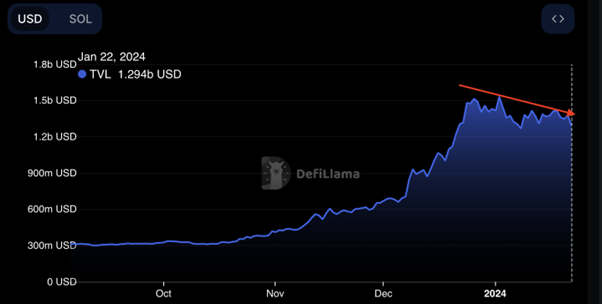
Solana network’s TVL, USD. Source: DefiLlama
Solana’ TVL, reached its peak at $1.53 billion Jan. 2, but experienced a 15% decline to $1.29 billion on Jan. 22.
On a positive note, the current TVL reflects a 42% increase from the previous month. In comparison, BNB Chain’s TVL increased by 6.5% during the same period, while the Avalanche network shrank by 18%.
Solana’s positive funding rate
It is also important for traders to analyze whether retail investors using leverage have been influenced by the recent price action. Open Interest perpetual contracts, also known as inverse swaps, include an embedded rate that is typically recalculated every eight hours.
A positive funding rate indicates an increased demand for leverage among long positions.
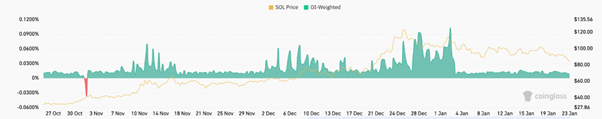
SOL OI-8-hour funding rate. Source: Coinglass
The latest data shows a funding rate below 0.0087% per eight hours, equivalent to 0.17% per week, which is not significant for most traders.
This is a stark contrast to the 0.72% per week charged to leverage longs (buyers) on Jan. 2, indicating that the excessive demand is no longer present.
It’s worth noting that the funding rate remained positive as SOL dropped below $100 on Jan. 22, erasing the gains from the previous month.
Considering the dip in Solana’s TVL and the declining interest in leverage longs, investor appetite for SOL seems to have plateaued.
From a technical point of view, Solana’s downside remains and may drop further over the next few days.
Solana price analysis
SOL’s price action has formed a descending parallel channel on the daily chart. This is characterised by a series of lower highs and lower lows that the price has recorded since turning away from a high of $126 reached on Dec. 25, 2023.
At the time of writing, Solana’s price trades 35% below this peak with the 50-day exponential moving average (EMA) at $67 acting as immediate resistance. Note that this is also where the channel’s middle line sits.
As such, increased selling from this level would see SOL drop further to seek solace from the lower boundary of the declining channel at $78.
Lower than that, the 100-day EMa at $73 and the $$70 psychological level would provide the much-needed support for the layer 1 token. This would represent a 15% decline from the current price.
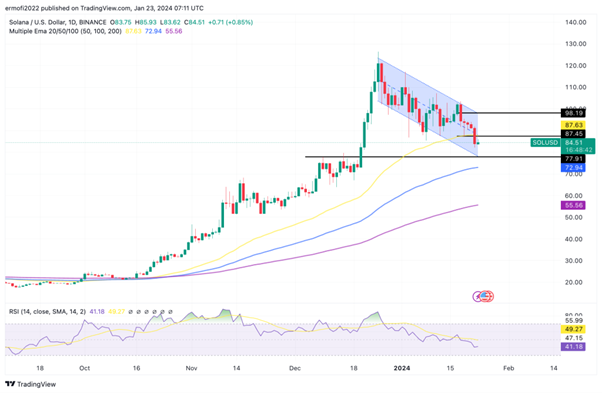
SOL/USD daily chart. Source: TradingView
On the upside, a daily candlestick close above the 50-day EMA would signal increased buying on the dips with the next line of resistance emerging from the channel’s upper boundary at $98.
Reclaiming the $100 level would confirm a bullish breakout from the bearish chart pattern with the bulls eyeing the $126 range high.